Visualization Management
Visualization Management is present reports visually, essentially, so you don’t need to create additional system management tables, you just need to modify the existing system management tables slightly.。
Firstly,you need to modify __reportTable__ , add a plotCommand cloumn.
1
2
ALTER TABLE __reportTable__
    ADD COLUMN plotCommand TEXT;
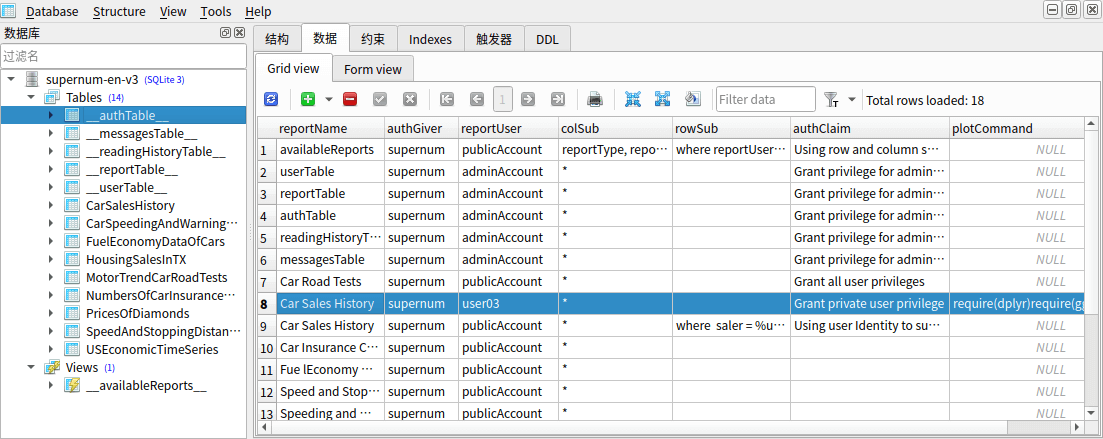
secondly,you need to modify __authTable__, add a plotCommand column.
1
2
ALTER TABLE __authTable__
    ADD COLUMN plotCommand TEXT;
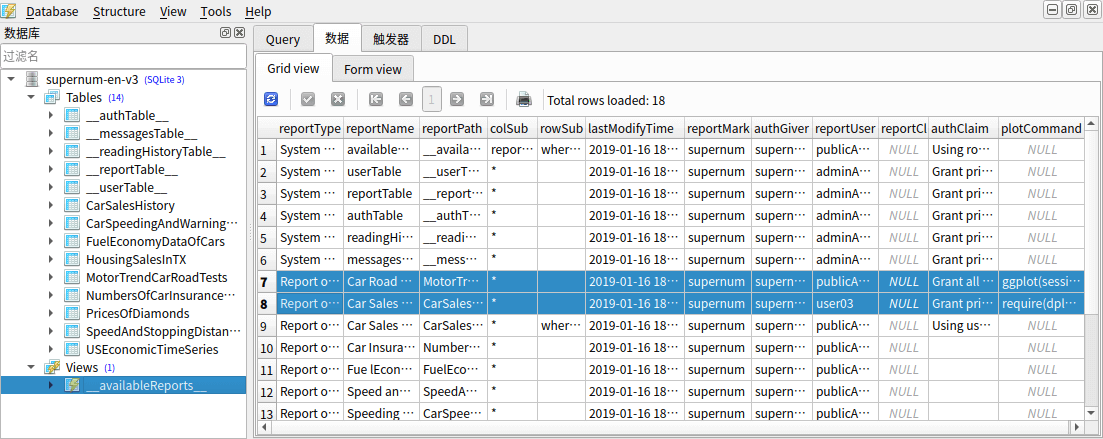
finally,you need to create an __availableReports__ view.
1 |
|
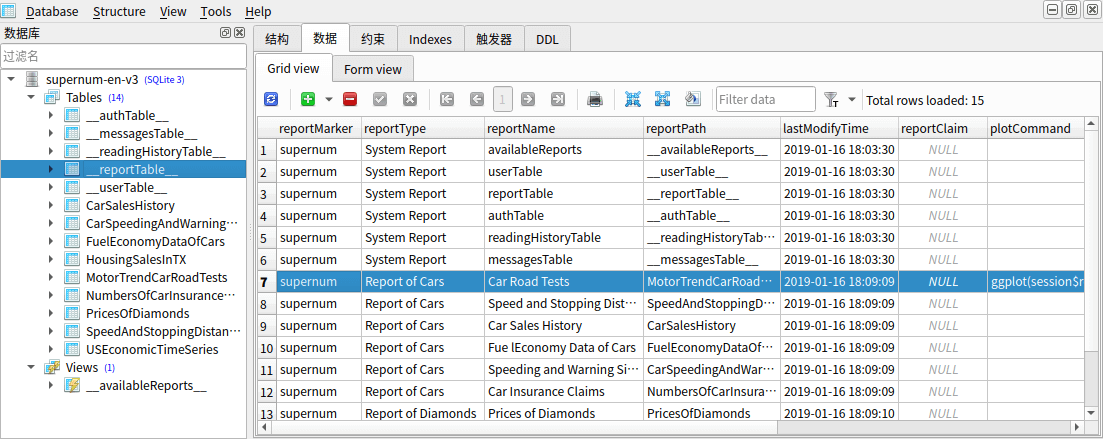
So far our Visualization Management has been set up. When we need to visualize the report for users, we just need to insert the plot command into plotCommand of __reportTable__ . For example, if we set the drawing command of CarSalesHistory to ggplot(s$report) + geom_bar(aes(saler, price, fill = saler), stat = sum, positon = stack) , then each user can see a bar chart showing saler’s turnover, and each user can only see the situation of his department. (Controlled by privileges).
plotCommand can be covered like permissions. For example, user03 can view all sales’ record. So we can customize a visual report for him. We only need to add hte plot command for user03 to Visualize CarSalesHistory into plotCommand of __authTable__ . Then user03 can view the overall status of salers and departments.
Note that report currently viewed by users are stored in s$report in the report platform.
As for Visualization Management, you only need to consider presenting specific reports in a specific visual way, or viewing specific visual reports to specific users. These maintenance tasks can be one-time.